Why these maps
Maps of Complexity grew out of my attempt to make sense of the scientfic field of complexity: where its ideas came from, how they travelled between disciplines, and which of them are still producing new work. The maps show 66 paradigms – 50 research programmes and 16 disciplines – in 7 families, and 202 influences between them.
They show my reading of the field, and they are biased by my perspective. They focus on Western science and leave out most other ways of knowing and traditions of thought. Some of these traditions show up in the maps through their influence, for example in Autopoiesis & Enactivism or in the relational programmes of the Symbiosis & Relational Ontologies family, but they are largely outside the maps’ scope. I also bring a conceptual framework of my own, which has been shaped by particular thinkers in the field – Kauffman, Juarrero, Cilliers, DeLanda, Friston and Levin among them.
Everything the maps show is an interpretation. Choosing which programmes exist, where one ends and the next begins, and which belong together are editorial decisions, and the timeline in particular reflects how I understand the field, and how my understanding is evolving through my work on the maps. The data collected for the maps can only stand in for these ideas or challenge them; they cannot prove them. The way the data are found and gathered is homemade and keeps changing. The guiding principle is heuristic fecundity – how well a map helps me see patterns and ask generative questions – more than representational accuracy.
How they are made
The maps combine two kinds of evidence, which check each other.
- Editorial judgement from sources. Which paradigms there are, when each began, which families they form and which influenced which are judgements made from histories of the field, founding works and their reference lists, and the records of institutions. Claude agents researched and drafted these judgements, including first estimates of each influence’s strength, and I made the editorial decisions. The reason for every judgement is recorded beside the data.
- Measurement of the literature. For each research programme, two yearly indices are computed from counts of publications, citations, books and institutions: how widely its ideas were taken up, and how much new work of note it produced. The same counts test the editorial judgements: whether an influence shows in who cites whom, whether a family’s members are read together, and whether a programme’s dates match its literature.
Where the two disagree, the disagreement is examined case by case. Sometimes the record was changed to match the measurement: most end years now follow a measured rule, and many influence strengths were revised against citation data. Sometimes the record stands, with its reason stated, where the measurement is known to be weak or where a connection is conceptual and does not show in citations.
I used Claude as an assistant for research, data analysis and validation, content drafting, and writing all the code needed both for this and for the presentation. Who did what is described below under Who did what.
The next five sections describe what is common to all three maps. The sections after them describe how each map draws it.
Paradigms and families
A research programme is a community working on shared questions with shared methods. It has founding works, people who continue the work, and institutions, journals or meetings of its own. A single thinker without such a community is not a programme, however important: Cilliers and Juarrero appear as people linked to programmes, and Helmholtz as the source of one programme’s key idea.
A discipline – statistical mechanics, game theory, operations research, Earth system science – is a whole field with its own chairs and journals. The programmes drew on the disciplines, but a discipline is not itself a complexity programme. The disciplines are shown as ongoing, and they are not measured.
The 7 families – Dynamics & Self-Organisation, Cybernetics & Systems, Ecology & Earth Systems, Complex Systems, Symbiosis & Relational Ontologies, Mind & Cognition, Social & Organisational Complexity – group the paradigms. A family brings together paradigms that are connected in two ways. Some connections are causal: one programme grew out of another, people moved between them, they worked on the same problems or with each other, and their literatures cite the same works. Other connections are conceptual: two programmes look at the world through the same lens, even where they rarely cite each other. The relational lens that the actor-network, assemblage and more-than-human programmes share with symbiosis, Gaia theory and biosemiotics is an example. Seeing a conceptual connection is an editorial act. The families are a reading aid, and their boundaries are not sharp.
Each paradigm has a start: the year of its founding work or institution, as the histories give it – for ecological anthropology, Geertz’s Agricultural Involution in 1963. A programme also has a peak and, where its new work has faded, an end. These dates summarise the measured lifecycle described below; the timeline and the Lifecycles view show the lifecycle itself. 17 of the 50 programmes have ended. A programme’s significance, from 0 to 10, rates its weight at its peak. It follows the programme’s rank by its highest uptake, and it is the part of the record most open to disagreement.
The paradigms come with their landmark works – 149 papers, 84 books, 17 events and 2 pieces of software, 252 in all – and 629 people, each with a note on their part in a paradigm. The 42 people who worked in three or more paradigms have a short biography. These works are chosen for the reader. They are kept apart from the lists of key works used in the measurement, so adding or removing one changes no measurement.
Influences
An influence runs from a source paradigm to a target. Each is one of five kinds. The kinds are tested in this order, and the first that fits is used:
- Critique (17): the target defines itself partly against the source, as Haraway’s sympoiesis responds to autopoiesis.
- Evolution (14): the target grows out of the source’s own community, whose people or institutions continue the work under new questions.
- Synthesis (19): the target unifies several programmes into one framework and names the source among them, or an umbrella programme includes the source as one of its parts.
- Application (42): the target uses the source’s methods, models or concepts in its own field, largely as they are.
- Foundation (110): the target builds a theory of its own on the source’s ideas or results, and reworks them in the process.
An influence is included when a citation, an acknowledgement or a historical account documents it. Its year is the earliest documented transmission: the paper, book, talk, course or institution through which the source’s ideas reached the target. The reading panel names that work. A transmission can come before the target began.
Its strength, from 0 to 10, rates how much of the target depends on the source; on the map it runs from 4 to 9. Each strength combines a judgement from the sources with a measurement: the share of the target’s literature that cites the source’s key works, set against pairs of programmes with no known connection. Where the measurement is reliable, the two count equally. Where it is only partly reliable – before 1980, for a small literature, or where one famous work makes up most of the citations – the judgement counts three times as much. Critiques and influences from or into disciplines rest on the judgement alone, because citation counts cannot tell disagreement from agreement, and the disciplines are not measured. Most judgements and the blend were made by Claude agents under a written brief; a few strengths are my own calls, marked as such in the record.
No paradigm has more than seven sources. Where ideas cross-pollinated, influences may run both ways between two paradigms or close a loop, when they are strong or documented by a dated work or event, and never as a critique. Influences that are weak, rest on a single passing citation or break these rules are recorded with their reasons and left off the map.
Uptake and generativity
Two indices describe each research programme year by year, from 1925 to 2024. They are kept apart because they describe different things.
- Uptake is how widely the programme’s ideas are used: how often the wider literature uses its name, cites its key works and mentions it in books.
- Generativity is how much new work of note the programme itself produces: how much of its own core work is among the most cited in its field, and when its key works appeared. It stands in for Lakatos’s idea of a progressive research programme, one that keeps producing new results; his own test, novel predictions, is not measured.
A programme can be widely used long after its new work has thinned. System dynamics kept three fifths of its peak uptake in 2024, while its generativity stood at a fifth of its peak. Generativity is the leading measure: the lifecycle is dated by it.
The data
The literature comes from OpenAlex, an open index of scholarly works and their citations.
- Publications are the works whose title or abstract matches a search query written for the programme. The query combines the programme’s name with a few distinctive phrases and excludes namesakes. Generic phrases such as “complex systems” count only together with a second term. The query for Catastrophe Theory, for example, matches “catastrophe theory” and the named catastrophes, such as the cusp, but not “error catastrophe”, a theory of ageing. Where two queries were bound to find the same works, the shared works count for the programme whose subject they are: complex adaptive systems in organisations, leadership and health care count for Complexity & Organisation, not for Complex Adaptive Systems. A matched work among the most cited tenth of its year and subfield counts ten times.
- Canon uptake counts the works that cite the programme’s key works – its canon – whatever words they use. A paper that builds on Prigogine without saying “self-organisation” still counts. The canon is a list of its own, taken from histories of the field and from the works the maps showed when it was first compiled.
- Books are counted by how often a few defining phrases appear in the English Google Books Ngram corpus.
- Institutions and events are dedicated institutes, journals, societies, conferences and degree programmes, each dated from a cited source.
Every query is tested on samples of the works it finds. A Claude agent judged each sampled work from its title and abstract under a written set of rules, and each verdict is stored with its reason.
- Precision is the share of matches that are really about the programme. Random samples from three eras are judged. Queries that do poorly are rewritten and judged again.
- Recall is the share of the programme’s key works that the query finds. It is often low, because founding works often come before their field’s vocabulary: Lorenz’s “Deterministic Nonperiodic Flow” never says chaos. Canon uptake makes up for this.
- Core or application. Samples of the most cited matches are sorted into core work, which develops the programme’s theory, methods or understanding of itself; applications of it to another field’s questions; and false matches.
- The early years. Many early matches are misdated or off-topic. So the works matched before a programme’s start and in its first ten years are judged one by one, or in samples where there are many. For four programmes whose start has since moved later – chaos theory, phase transitions, catastrophe theory and cellular automata – the first ten years were counted from the earlier start. The judgements correct only the years they cover; the rest of the decade uses the era’s samples. All but three matches before a programme’s start, from 1925 on, are judged. Of these 891 works, 616 are false matches and 249 precursors; both are removed from the counts. The few precursors that the programme’s own works cite are drawn as its ancestors. The other 26 are the programme’s own work or applications, and stay in.
From counts to indices
Raw counts are distorted in known ways. Each correction below removes one distortion; the limits section lists what remains.
- Fields differ in size
- Publications are counted per million works of the programme’s home fields in that year.
- The literature grows
- Citing works are counted per million works published that year, so recent decades do not dwarf the 1950s by volume alone.
- Reference lists grow longer
- Citing works are divided by the average length of reference lists that year, since longer lists alone raise the count.
- Old works lack abstracts
- OpenAlex has abstracts for far more recent works than old ones. Matches found only in an abstract are divided by the share of the programme’s own title matches that have an abstract that year, compared with 2000–2020. Where a year has few title matches, the common curve of all programmes is used.
- Searches catch false matches
- Counts are multiplied by the share judged relevant in their era. The years judged one by one use their own judgements, and matches before a programme’s start that are false or precursors are removed.
- “Most cited” means little where most items are never cited
- A work counts as among the most cited when its citations reach the top tenth of the articles with a reference list in its year and subfield. Where a subfield has too few such articles in a year, the threshold comes from its field or from all articles, scaled by the subfield’s own ratio to it in 1990–2005. A book chapter or conference paper is compared with works of its own type, whose threshold lies at about a quarter of the articles’. A work in another language is compared with articles in its own language.
- One famous work can dominate
- No key work may make up more than a quarter of a programme’s citations, and a canon work among the most cited matches counts once, in the canon.
- Different measures have different units
- Each measure is divided by its average over a period in which all are reliable, so works, citations and book counts can be averaged. These averages are fixed numbers, taken once over the 50 programmes the map held on 22 October 2026, as is the common curve of abstract coverage. Adding or removing a programme therefore changes no other programme’s curves or dates.
- The early record is thin
- Early publications and citations count less, least before 1955 and fully only from 1985. Books drop out after 2022, where the book corpus ends.
- Yearly counts are noisy
- The series are smoothed over nine years, four either side, and most of the counts behind them are first smoothed over five years. A date read from them is good to a few years.
- The last years are incomplete
- The series stop at 2024.
Uptake is then a weighted average of publications, canon uptake and books. Institutions and events raise it by at most half: they never create uptake where there is none, because institutions outlive their programme’s productive years.
Generativity has two parts. The larger (70 %) is the programme’s most cited works, counting only the share judged core work, since applications are uptake. The smaller (30 %) is the years in which its canon’s works appeared. The weight between the two is fixed, set by a reference set of 50 programmes, not by whichever programmes are on the map. Every programme but one has 8 to 17 canon works from its own years, whatever its size, so the canon years add a similar amount to each. Ecological Economics has 4, because three of its founding books, from 1971 to 1987, are older than the programme. Some programmes have few core works among their most cited: small ones, and large ones whose most cited works are mostly applications. For them the canon years make up most of generativity, and the curve shows mainly when their key works appeared. For 35 of the 50 programmes, the canon years give more than half of generativity at its highest value. (That is why the end is read from the most cited core works alone, see below.)
Dating a lifecycle
The start, peak and end of a programme summarise its measured lifecycle in a few years. Each is read from the measurement by a fixed rule, with a range for how far it could move:
- The start is the founding work’s year from the histories. It stands as long as the earliest year the measured emergence could fall in – the first year in which generativity reaches a tenth of its highest value and stays there for five years – lies no more than five years after it.
- The peak is the period around the highest value in which generativity stays at 70 % of it or more.
- The end is read from one count only: the programme’s core works among the most cited, per million works of its home fields. A programme has ended once that count has stayed below a third of its best ten-year average for five years, and is ongoing while its last five measured years average a third or more. By default the end year lies within five years of the last year the count stood at a third.
The ranges come from measuring again with one key work left out at a time – one work more or less moves the emergence or the peak by three years or more for 20 of the 50 programmes – and from drawing the judged samples and yearly counts again 200 times. Where a programme’s measurement is unsure or rests on fewer than about one such work a year, its record is set to the year inside the range closest to the date its sources give. Three programmes depart from the end rule, each with its reason recorded. Gaia theory is ongoing, because new work entered it after the years its few counts give. Complexity economics is ongoing, because work continues in reviews and books that the counts miss, and part of its later work is counted under econophysics. Second-order cybernetics ends in 1985: its counts rise only from the 1990s, when the name spread retrospectively, and so measure its later uptake more than its generative phase.
Key works older than a programme’s start, and the few judged precursors its own works cite, are its ancestors: part of its lineage, but not of its own output. Influences dated no later than three years after a programme’s start are its founders.
Comparing the two kinds of evidence
Where the measured data and the editorial record can be compared, they agree or disagree as follows.
- Starts. Every programme’s founding work, as the histories give it, fits its measured emergence: none lies more than five years before the earliest year the emergence could fall in.
- Ends. 47 of the 50 programmes end where the measured rule puts them; three depart, each for the reason given above.
- Influence strengths. Citations pick out the strongest influences clearly but barely order the middle of the scale: when the editorial ratings were first set against citation reach, across 79 influences between programmes, their rank correlation was 0.15. That is why each strength combines the measurement with a judgement.
- Families. Measured by which programmes’ key works are cited together and which topics their literatures share, the seven families group the programmes far better than chance: 15 to 19 standard deviations above random groupings of the same sizes, and 76 to 83 % of the best grouping a clustering algorithm finds. The literature alone forms four or five groups; the seven I kept also reflect conceptual connections or differences, lineages in the historical record, or a rule that uses influence strength to place programmes.
- Works. For 150 of the 168 landmark works of a programme, the works citing them lean most to that programme or to a paradigm the work is linked to. Four landmark works – one of a programme and three of disciplines – lean clearly to another family; three of them are older than the programme they lean to.
- Judging. Two judging agents’ shares of core work differ by up to about 13 percentage points, mostly because they draw the line between core work and application differently.
Limits and corrections
Each limit below comes with what is done about it, if anything, and what remains.
- OpenAlex is thin before the 1960s
- Early publications and citations count less, the early decades rely more on books, key works and events, and early matches are judged one by one. The early parts of the curves are still rougher than the later ones.
- The literature counted is mostly English
- Where another language accounts for a tenth or more of a programme’s literature, its own terms are searched and judged against works in that language: German for Social Systems Theory and Second-order Cybernetics, and French, Spanish and Portuguese for Complex Thought. Other programmes are measured in English only, and some key works, such as Bogdanov’s Tectology, could not be found in OpenAlex.
- Searches miss works and catch false ones
- Precision is judged in samples, canon uptake counts citing works whatever their words, and matches in abstracts are corrected so that old and new works can be compared. A programme whose vocabulary is generic is still measured less precisely.
- The line between core work and application is a judgement
- It is drawn under written rules, in samples from each era. Two judging agents differed by up to about 13 points in the share of core work, which shifts the level of generativity more than its shape.
- Small programmes have few works to count
- Small programmes – Complexity Sociology, Basal Cognition and Cynefin, with 135 to 355 matched works each since their start – are measured noisily. Their dates follow the same rules, with wider ranges, and the strengths of the influences into them rest mostly on the literature.
- Umbrella programmes score low in generativity
- Much of complexity science’s own work is counted under its offshoots, such as network science. Nothing corrects for this; the maps show the offshoots as its descendants.
- Institutions are shared in fixed proportions
- Several institutions moved from one programme to another over time; the measurement splits each one the same way throughout, and nothing corrects for this yet.
- Bibliographic records contain errors and change
- A record can merge two works, be dated by a reprint, or disappear. In November 2026 a screen flagged the canon records most likely to belong to other works, a Claude agent checked each of them, and the wrong ones were removed or replaced; excluded records that OpenAlex has since changed are followed up. Some errors surely remain.
- Histories under-credit some people
- Histories of science under-credit women and others outside the field’s centres. I try to correct for this when choosing people and works, but omissions surely remain.
- The scope is one tradition
- The maps cover complexity as Western science developed it. Other traditions appear only where they influenced it.
The timeline
The timeline draws the 50 research programmes as bands flowing through time, from left to right. The disciplines are not drawn. Selecting a band, an influence or a person fades the rest by how far it lies from the selection.
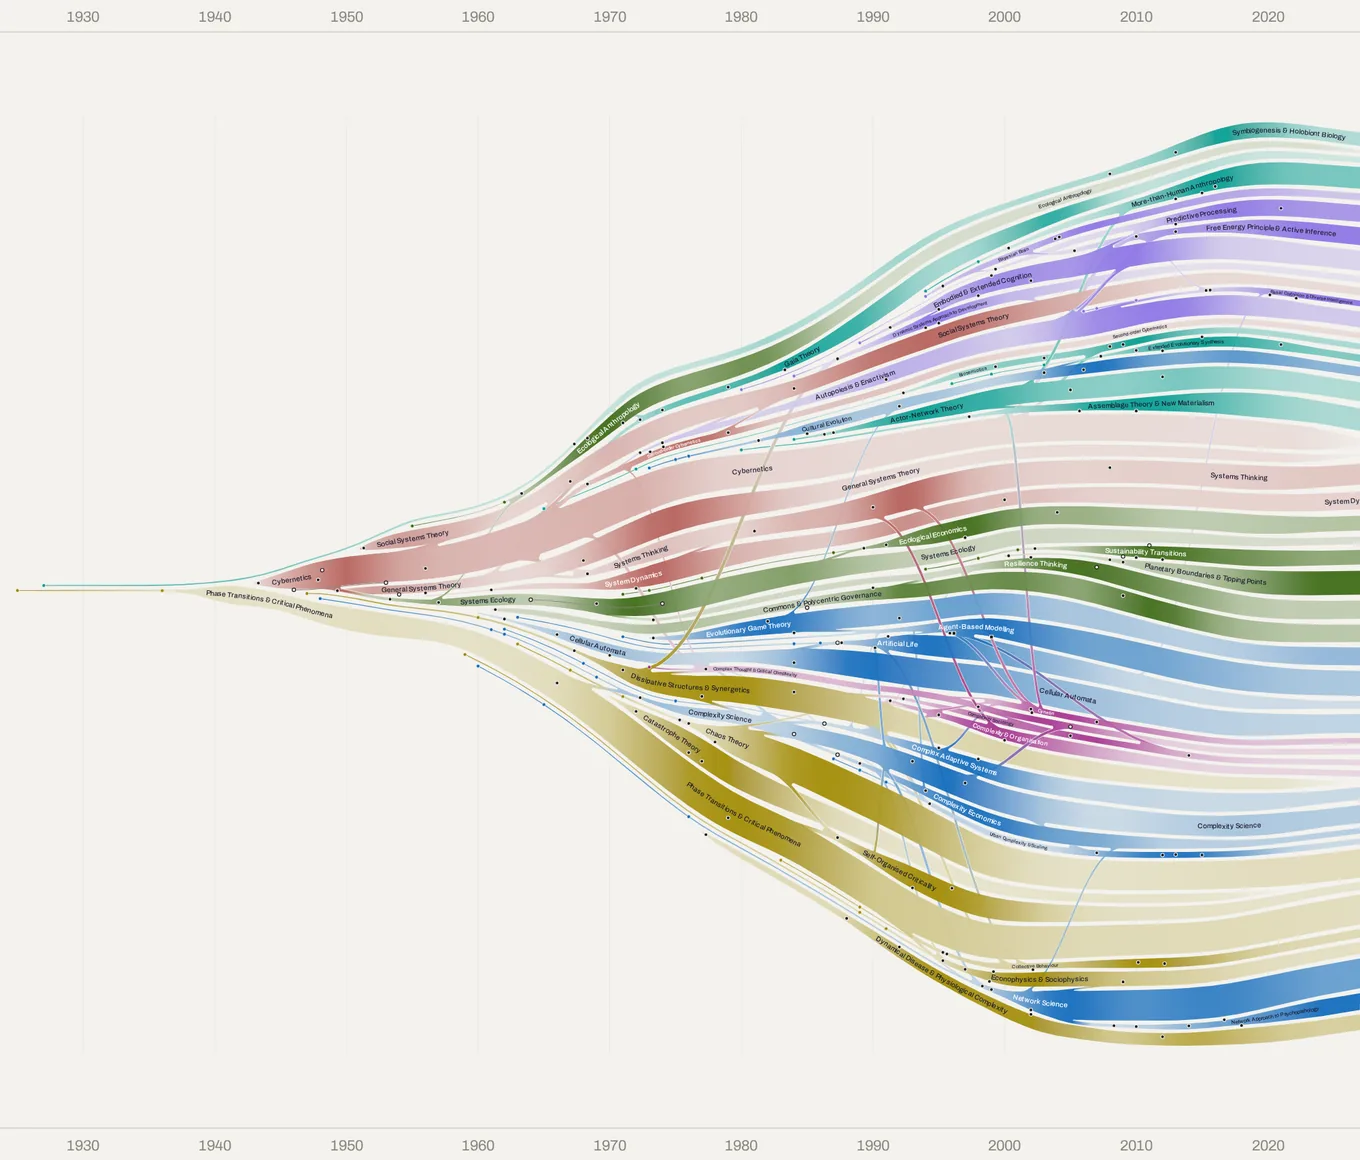
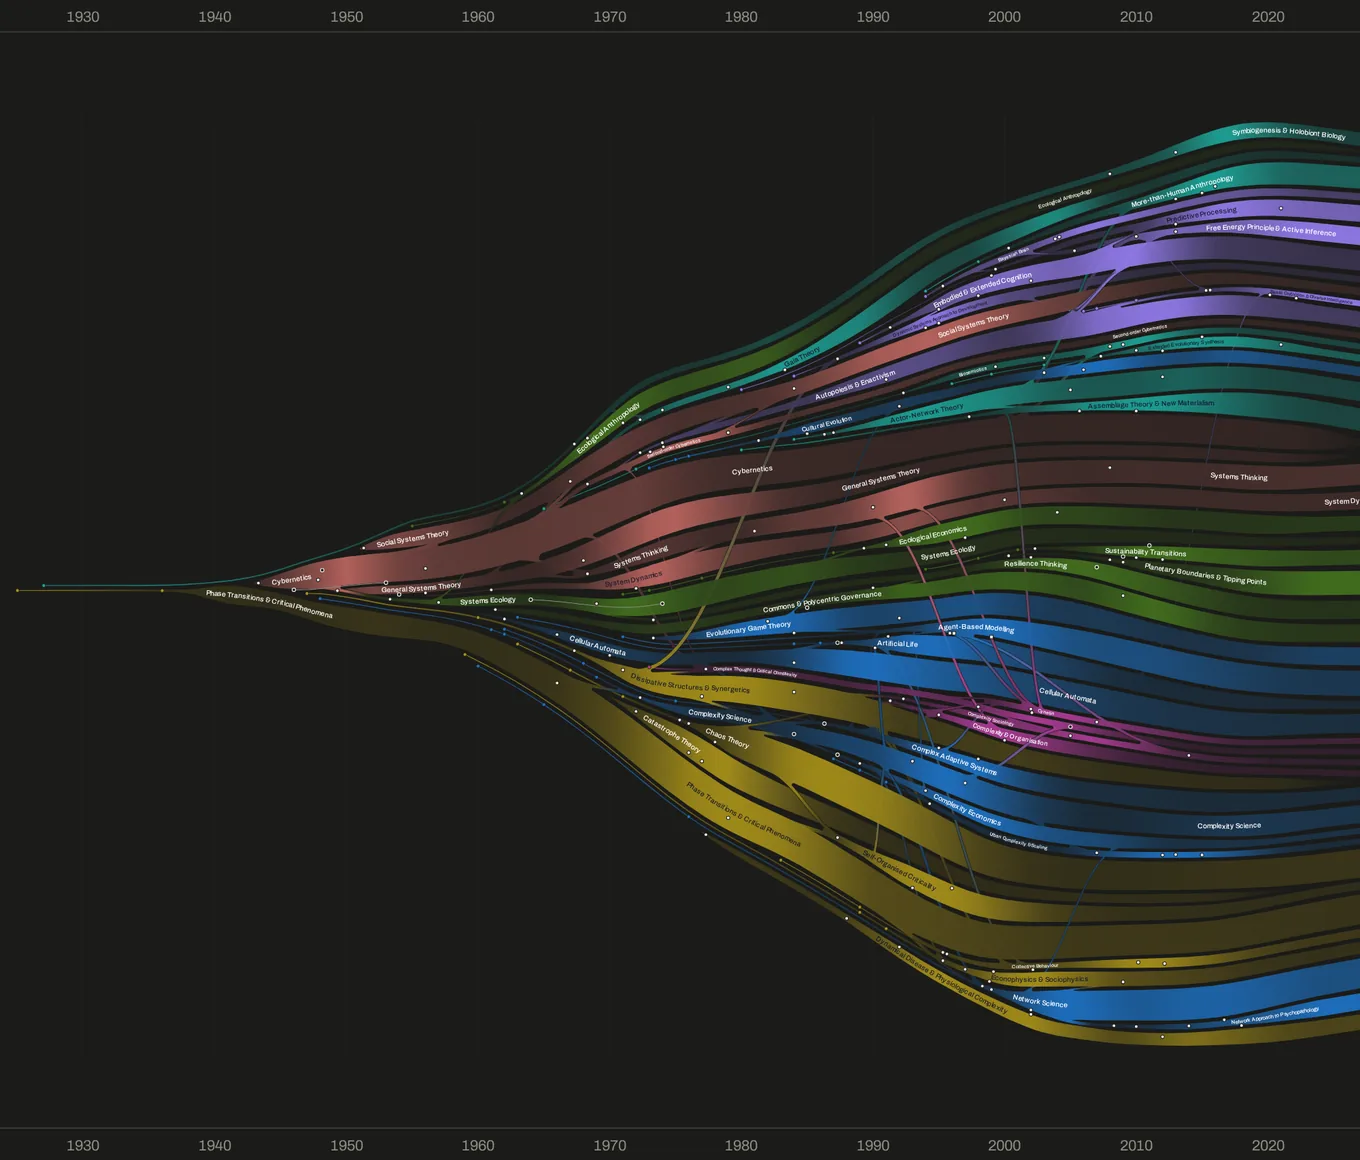
A band is a thin thread until the programme’s measured emergence, and its height then follows the programme’s uptake year by year. After the programme’s end the band runs on while its uptake or generativity stays at 15 % of its maximum or more, then tapers away. The heights level off at both ends of the scale, so the largest programmes do not overwhelm the rest, and every band stays thick enough for its name. A thread leads into a band from its ancestors, with their works marked on it.
The timeline has two readings, chosen under Show. Shape and shade, the default, colours a band darker the closer the programme is to its own generative peak, so a small programme at its peak looks as vigorous as a large one.
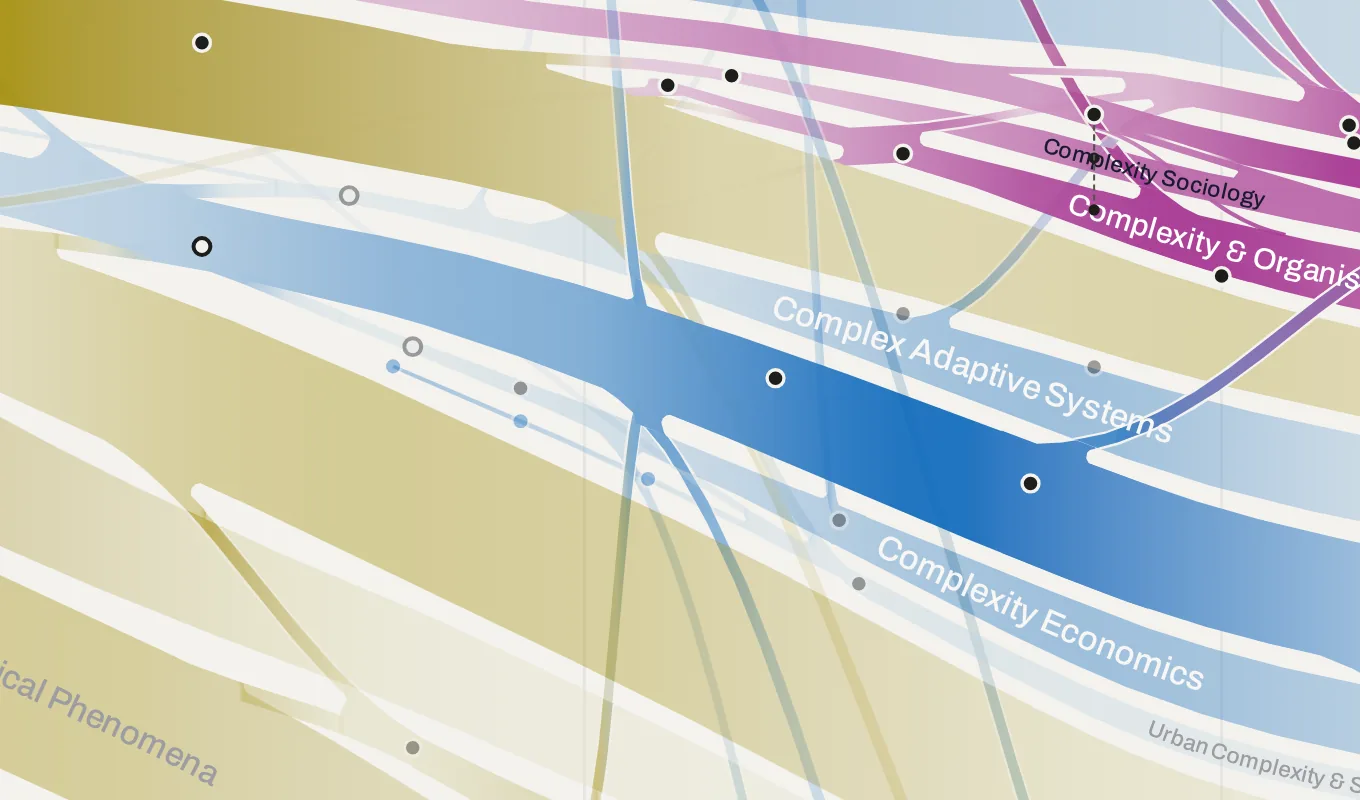
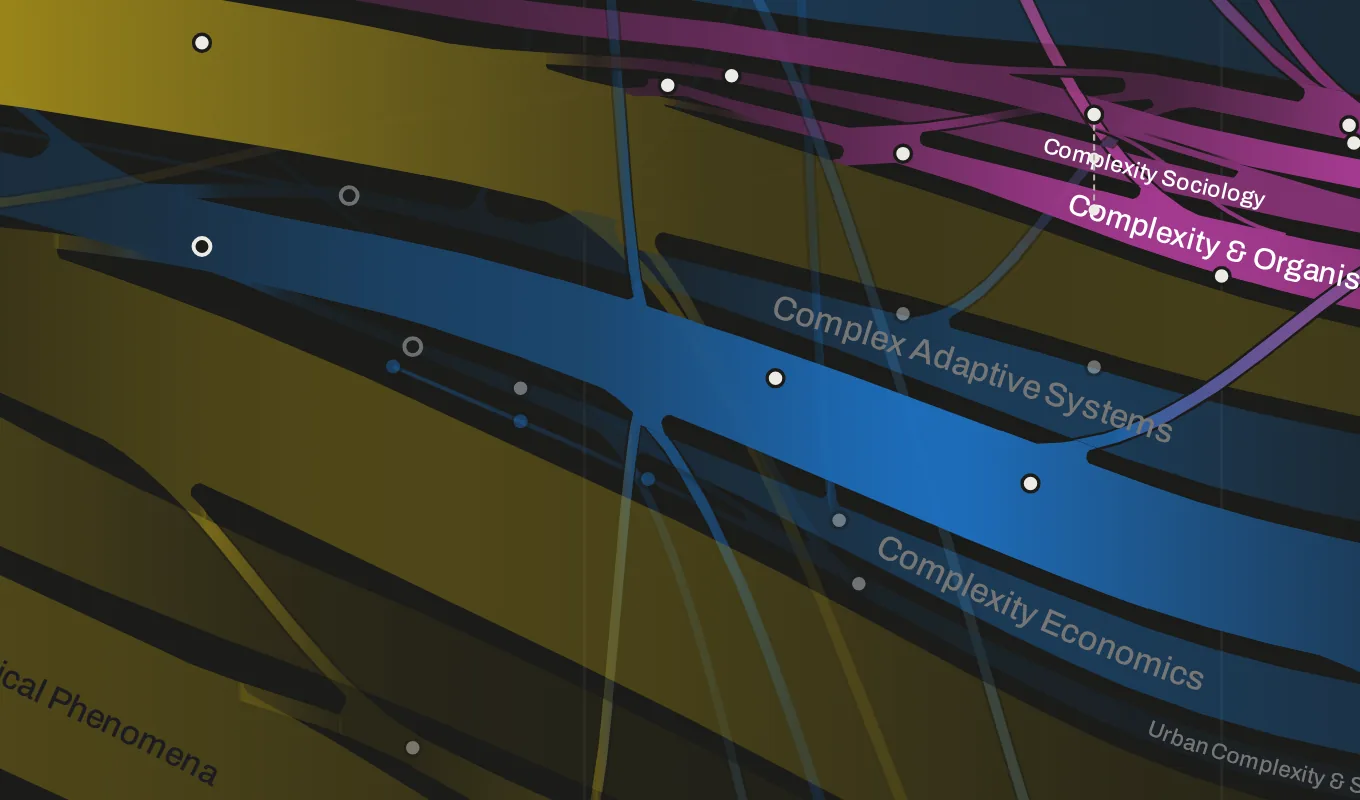
Core and halo draws the same band as a pale halo with a solid core inside it. The core’s share of the band is the share of the programme’s literature that is core work among the most cited, drawn in proportion so that a share of a quarter or more fills the band. A programme whose literature is mostly use and application has a thin core.
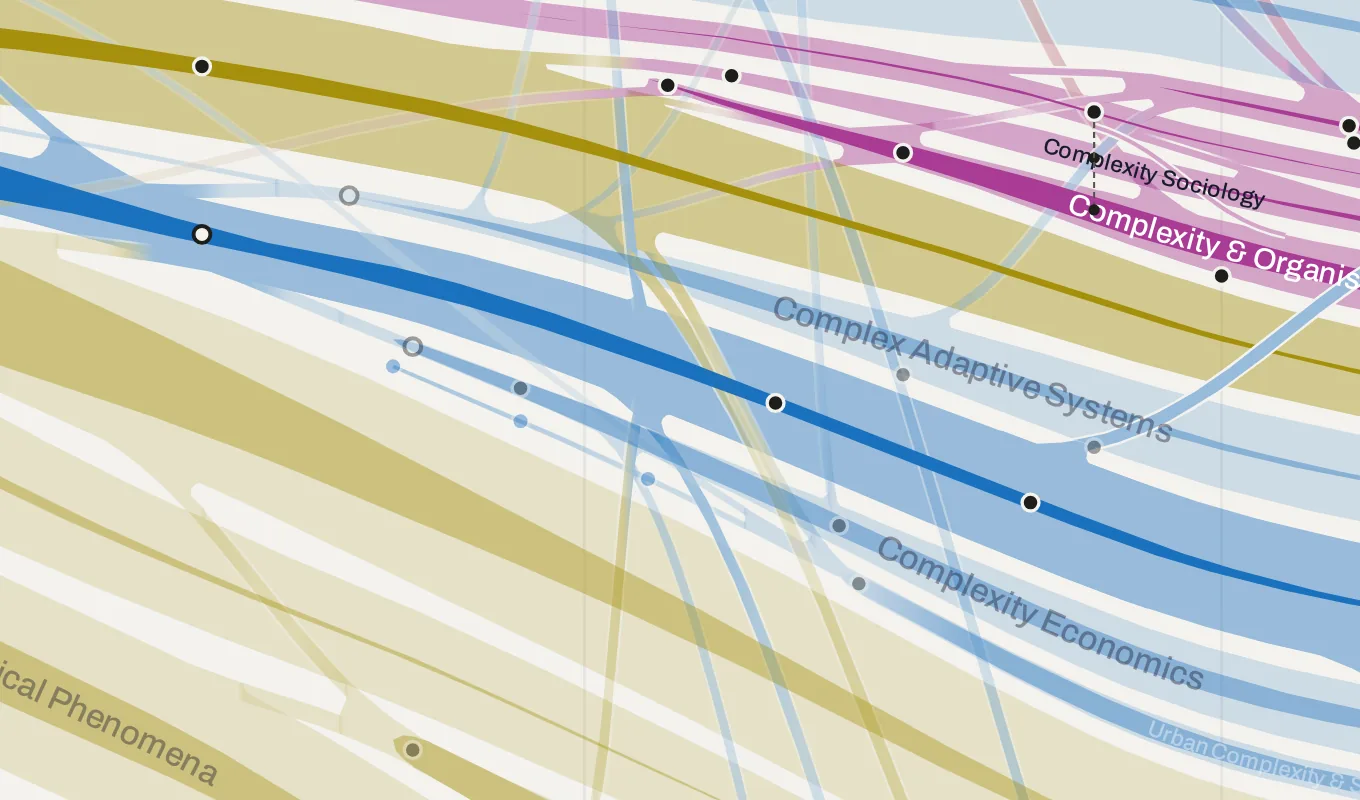
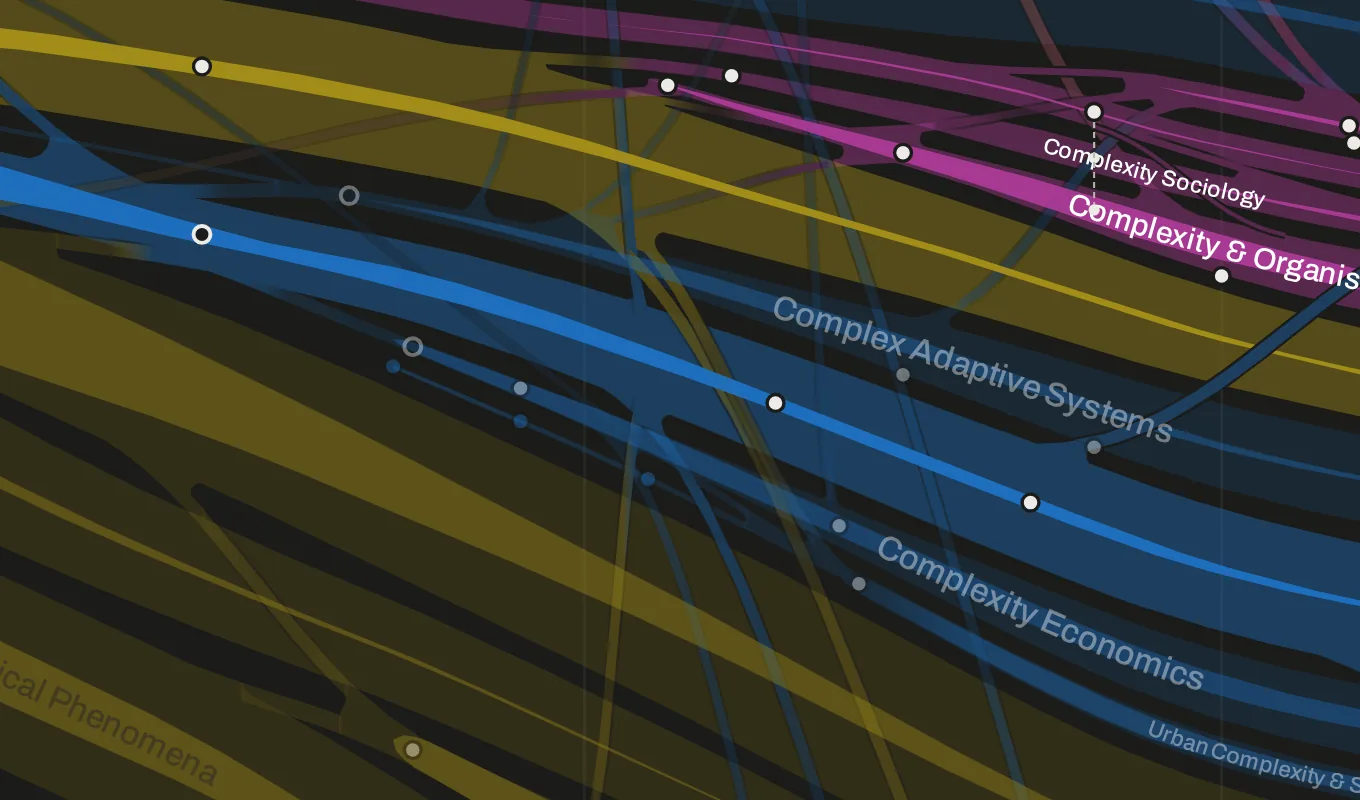
Strands are the influences of strength 6 and up, as wide as their strength. A strand leaves its source a few years before the influence’s year and joins its target a few years after it, or at the target’s start for a founder. In shape and shade, where a strand crosses another band, it is drawn over the band where the strand’s colour is the more intense, and under it where the band’s is; in core and halo, strands run over the pale halos and under the cores. Weaker influences, those with no room to leave their source, and those between neighbouring bands too close for a strand to cross the gap, are drawn as thin lines from border to border, shown only when one of their programmes is selected or hovered. Works and events are marks inside their band at their year; selecting a band labels its works.
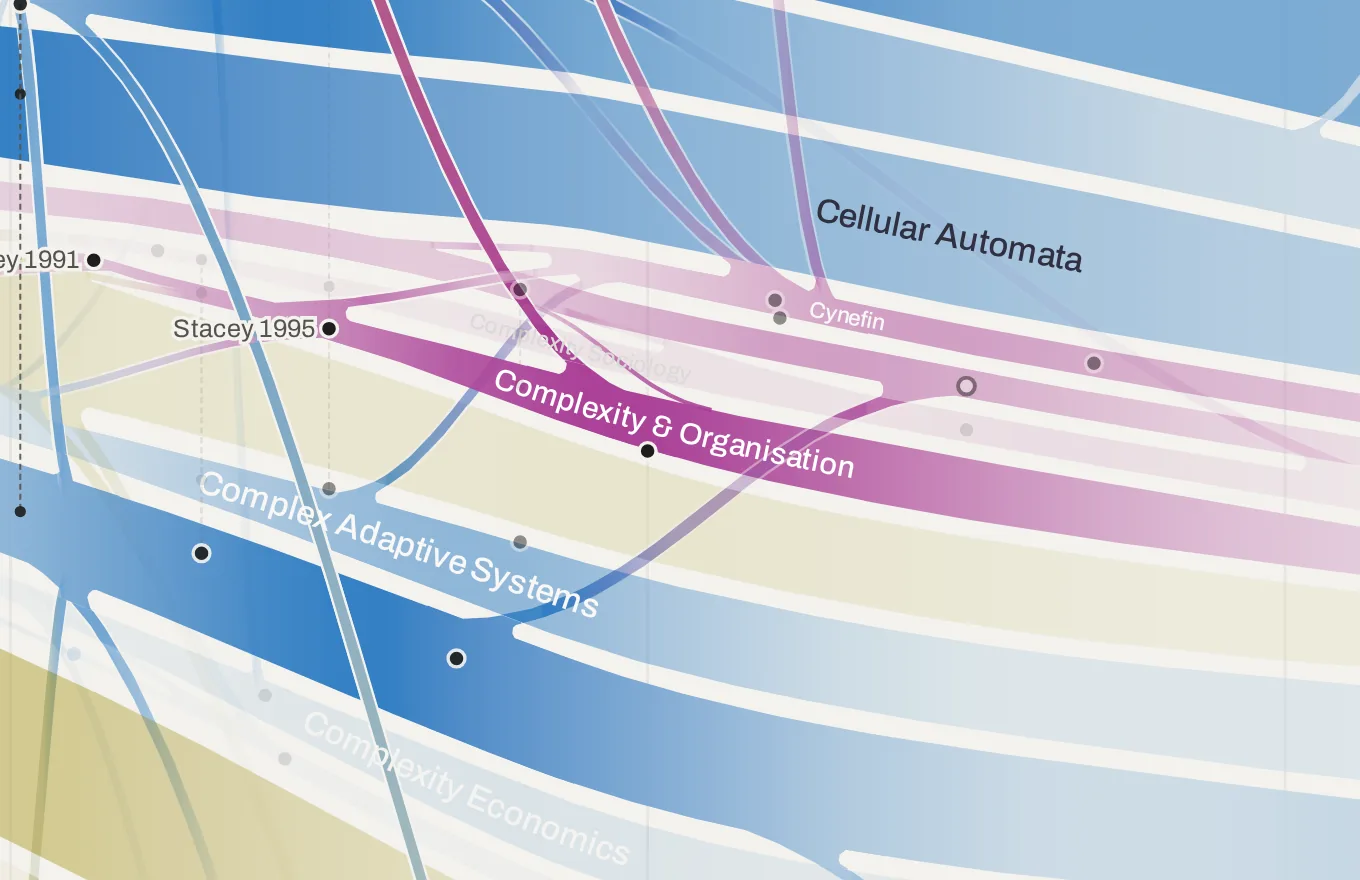
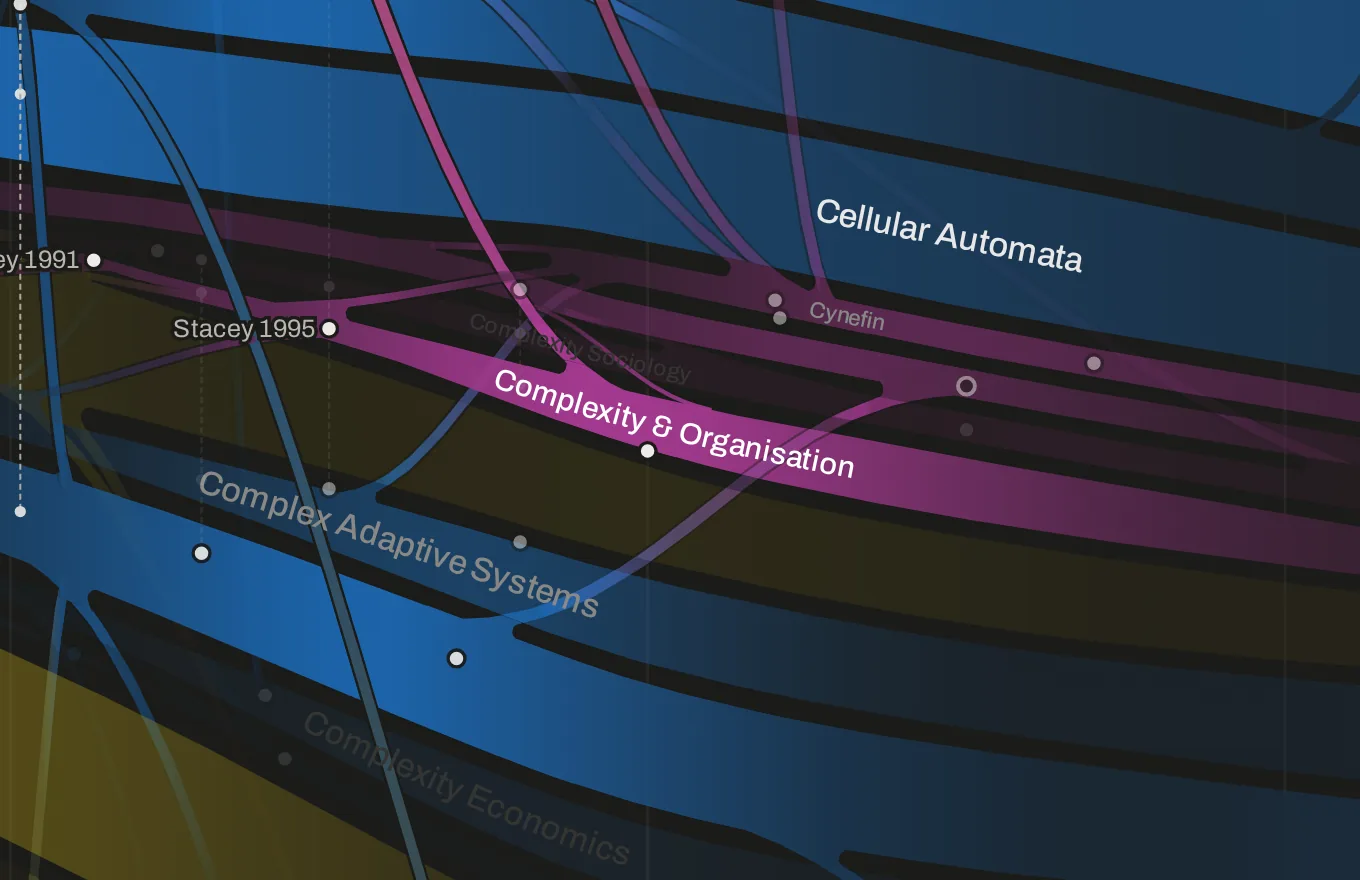
The order of the bands, from top to bottom, is computed. A search looks for the one order, kept for all years, in which strands cross the fewest bands, programmes with many influences sit near the programmes they influence, linked programmes stay close, a programme that grew out of another (an Evolution) starts beside it, and a source that shaped a programme at its start counts three times as much as one that came ten years later or more, since an early source shapes a programme more. A second step then sets each band’s height on the page year by year, keeping gaps between bands and the curves gentle. Strands leaving the same side of one band at about the same time nest: the one travelling farther leaves first, so they do not cross. The order is fixed once found, so the timeline keeps its shape when the data change a little.
The timeline needs Chrome 111, Edge 111, Safari 16.2, Firefox 113 or a later version, for its colours.
The network
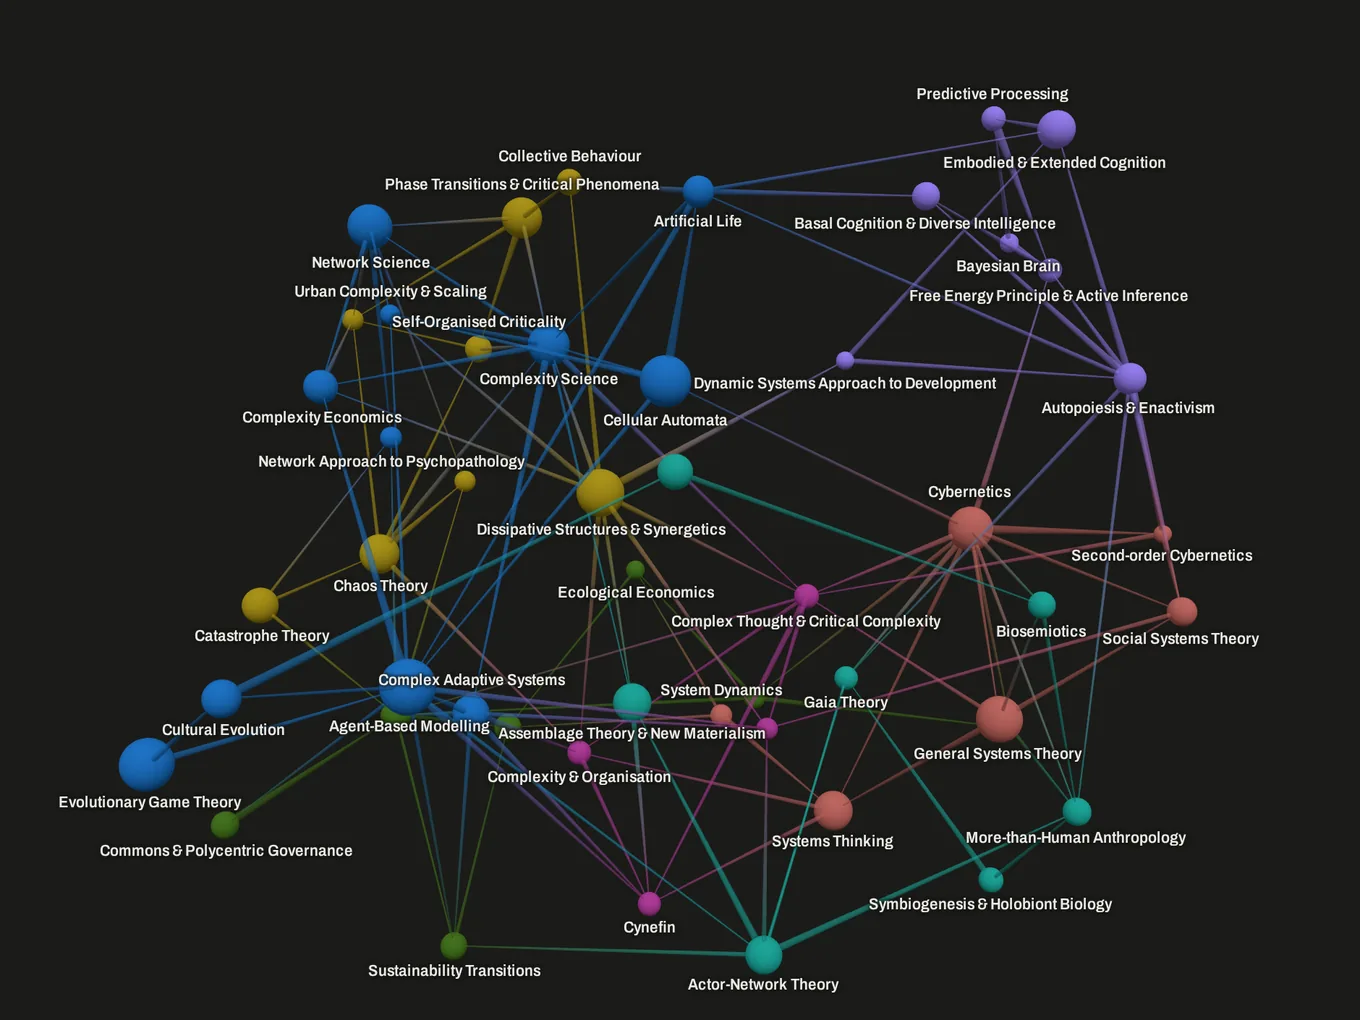
The network view draws the paradigms and their influences in three dimensions. Each programme is a sphere sized by its significance, and each influence a link that narrows from source to target. The layout is computed once, with linked paradigms pulled together and all others pushed apart. Under Show, the disciplines can be added, each a transparent balloon around a small core, and with them their influences, so that all 202 are shown; so can the people, drawn beside the paradigms they worked in. Each kind of influence can be hidden. The view needs WebGL.
Lifecycles
The Lifecycles view gives each of the 50 research programmes a panel of its own, on one time axis from 1925 to 2024, the last year measured. The solid line is uptake, the dashed line generativity; the shaded band is the peak stated in the data, and ticks below the baseline mark the programme’s first and last years, so the record can be read against the measurement. Selecting a programme outlines its panel and marks its works and events below its baseline at their years. The panels start in one column per family, ordered by first year; the tools above the view group them by decade or not at all, sort them by either peak, by the uptake kept today or by name, and fit them into one column per group, one row per group or lines.
The lines can be read on two scales. Relative to peak, the default, draws each line against its own highest value up to 2024. Every programme fills its panel, which shows the shape and timing of its life – when it emerged, peaked and declined, and whether its uptake outlasted its generativity – but not its size.
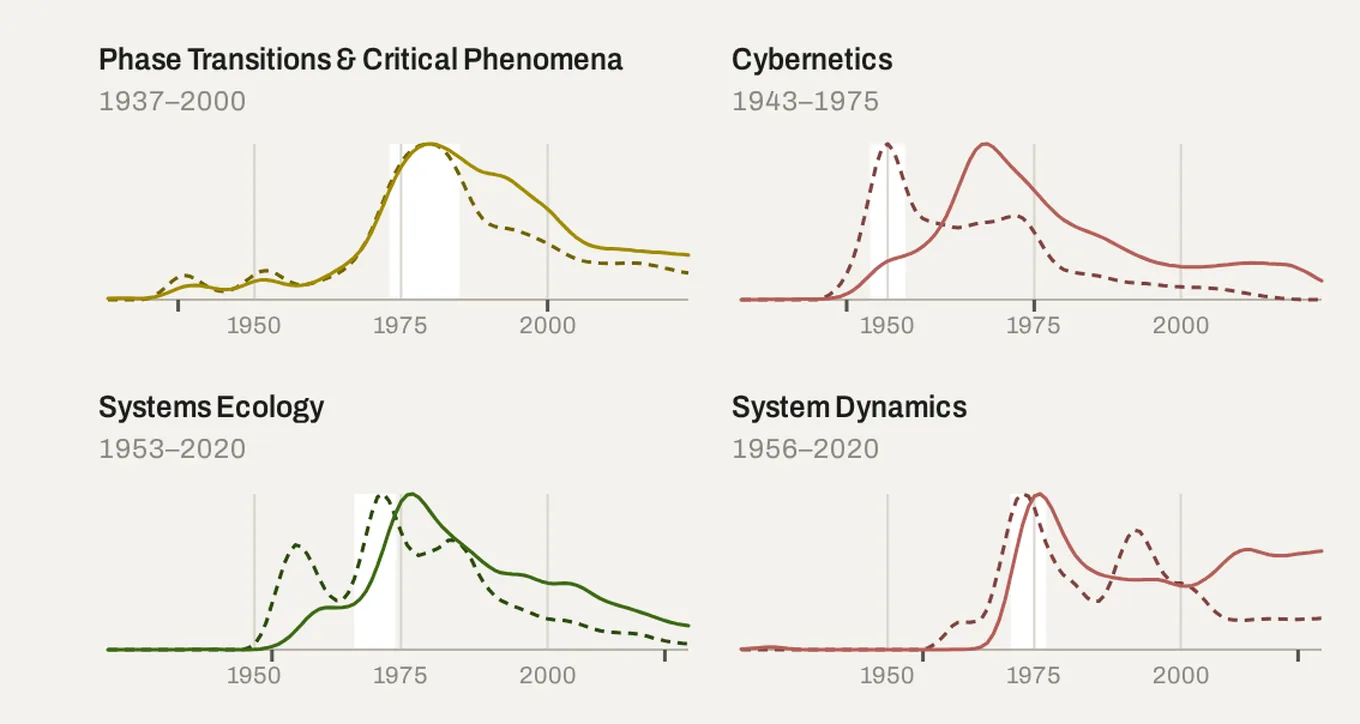
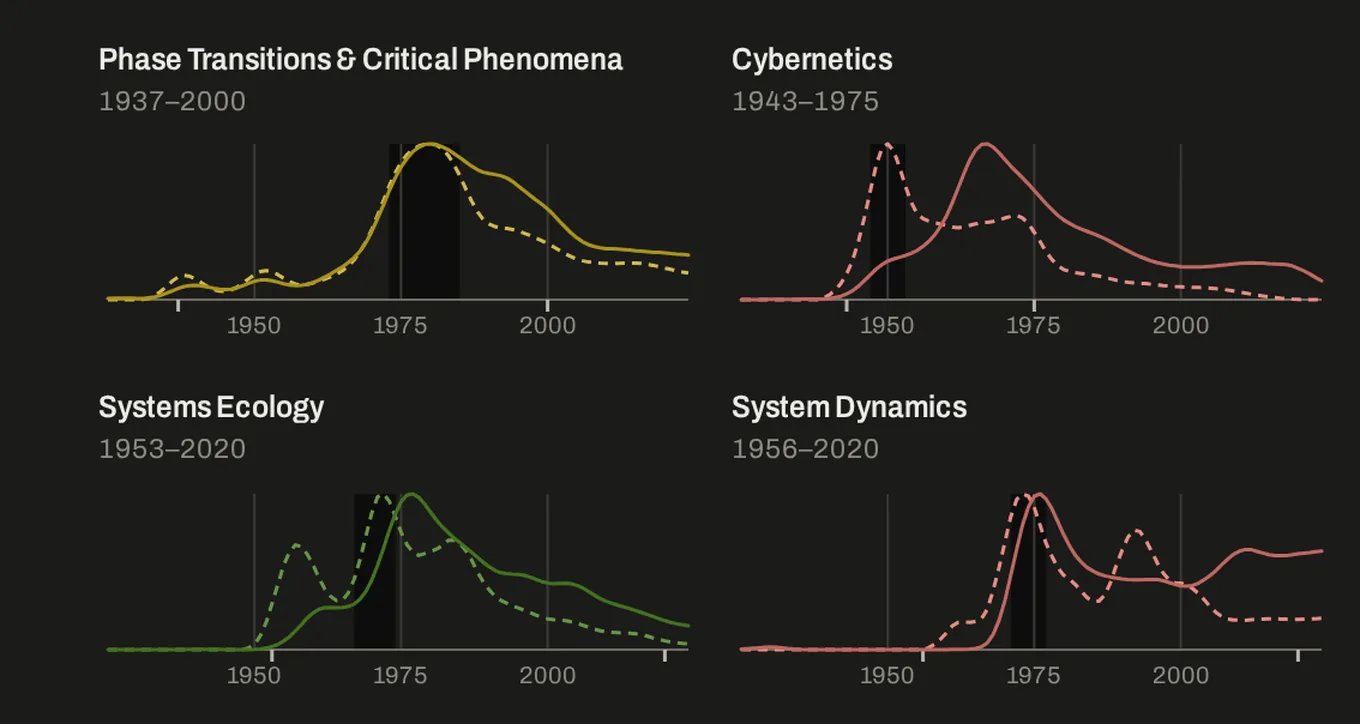
Works per million in its fields draws counts instead: the solid line is the works matched to the programme, less the share judged false matches, and the dashed line those among the most cited tenth that are judged core work, both per million works of the programme’s home fields. These are the publications behind the two indices, without citations, books, events or canon years. Both lines share one axis, so it shows how large a programme’s literature is and how much of it is core work of note. The axis has a square-root scale, so small values are not lost at the baseline; it is labelled at its top and at a quarter of its height, which is a sixteenth of the top value. In the median programme, top core works peak at a twentieth of all works’ peak, which the square root draws at just under a quarter of the height. The home fields differ in size, so heights compared across programmes are only indicative.
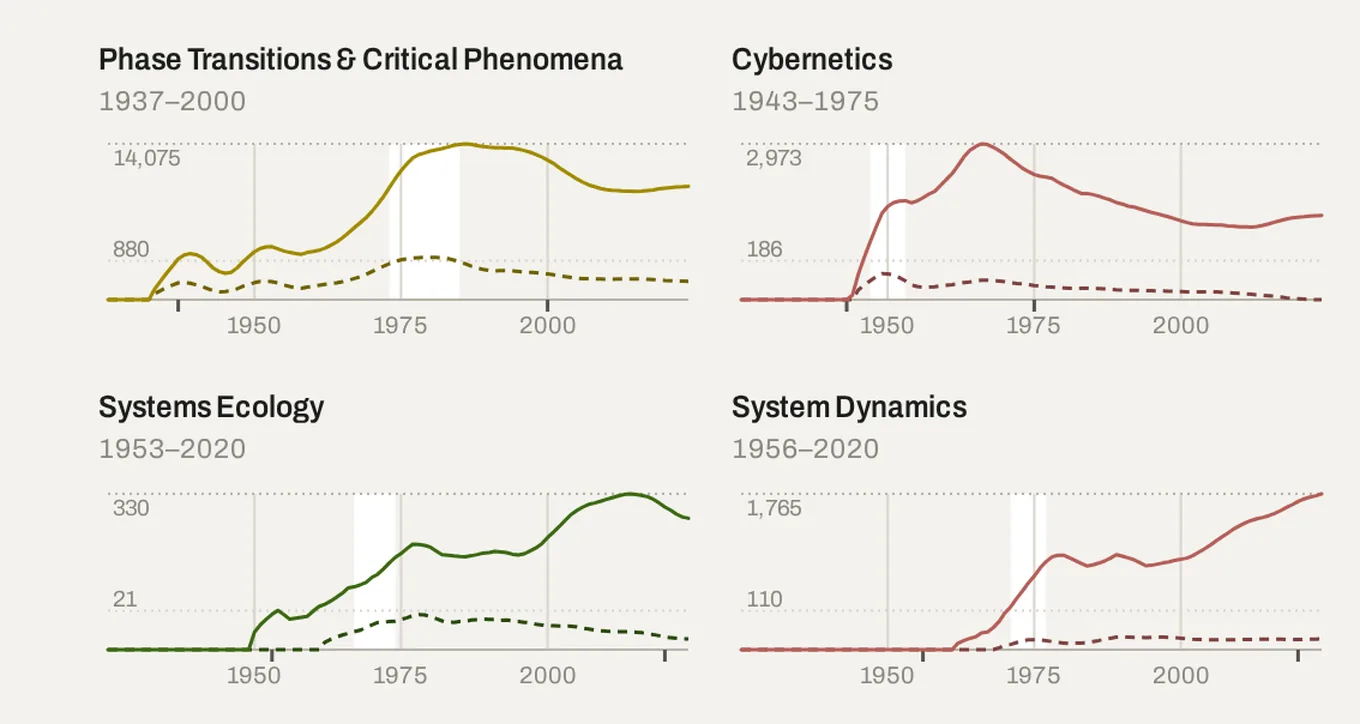
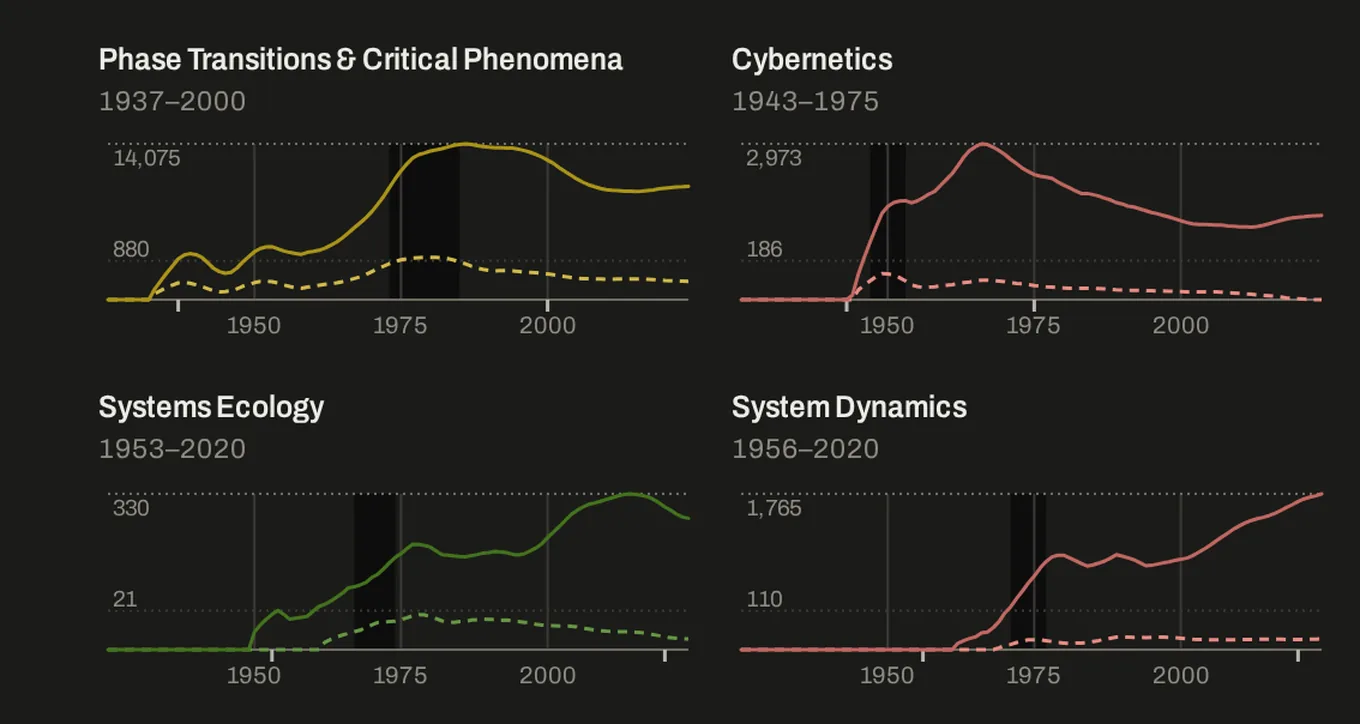
Because the series are smoothed, a rise or a fall is spread out, and a date read from a line is good to a few years. The lines stop at 2024: a line that ends high may still be rising or already falling.
In every view, the reading panel gives a paradigm’s description, years, people, ideas, works and influences; an influence’s kind, strength and the work that dates it; or a person’s part in each paradigm.
Sources
Dates and influences rest on primary works and their reference lists wherever these could be read, on historical accounts (such as Waldrop’s Complexity) and, for founding dates, on the Wikipedia articles of each field. The measurements rest on OpenAlex, the Google Books Ngram corpus and the pages of the institutions themselves. The data files can be downloaded: paradigms, influences, descriptions, people, works and the measured uptake and generativity. The influences file gives the work behind every influence. The source code, the data and the research records behind the measurements – queries, samples and their judgements, scripts and notes – are on GitHub at github.com/wowo101/maps-of-complexity; errors and suggestions can be reported there.
Who did what
The maps were researched and built with Claude, Anthropic’s AI model. I directed research and development, defined the information architecture and the conceptual framework, and made the editorial decisions: which paradigms and families there are, the rules for dating, and every case where the record departs from a rule. Many of these decisions are marked as mine, with their dates, in the project’s records.
Claude searched and read sources, drafted the data, the descriptions and the biographies, wrote the OpenAlex queries, ran the measurements and wrote the code. Work that needed many separate judgements was given to Claude agents working under written rules: judging sampled works as relevant or not and as core or application, rating influences against the evidence, and checking the canon’s records. Each verdict is stored with its reason. Where this page says a work was judged, a Claude agent judged it. Other Claude agents reviewed the data, the measurements and the code independently, and the errors they found were corrected. I tested, reviewed and edited the results.
Claude agents checked claims against publicly available sources and my own research library where possible; a small number of unconfirmed claims remains. Validation, just as overall development of this site, will stay work in progress.
Linda Doyle contributed important feedback and great ideas – the timeline and network views wouldn’t exist without her. But most importantly she's pushed me to make this real when I was stalling - in this way the whole website wouldn't exist without her.
All descriptions should be considered drafts under review. Errors are likely in a data set of this size; corrections are most welcome, as issues on GitHub, ideally with a source.
Licences
The data – paradigms, influences, descriptions, people, works and the measured indices – is in the public domain under CC0 1.0; attribution is welcome. The source code is published under the Mozilla Public License 2.0, and the site’s texts, images and visual design under Creative Commons Attribution-ShareAlike 4.0. The typefaces (Literata, Archivo) are under the SIL Open Font License; d3 and three.js under the ISC and MIT licences.